Near Real-Time Proactive Alerts

Ok, so besides App Analytics obviously – one of the most bestest and awesomest new features to come out of App Insights recently has gotta be proactive alerts in near real-time.

It might be the best thing since custom dimensions.

The way it works, AppInsights will auto-magically scan your data, and alert you to anomalies that might be major service issues. The awesome part is

  1. Absolutely no configuration required. App Insights studies the normal behavior of your service, and finds anomalies from that baseline.
  2. This could really save your ass! The alert should come-in about 10 minutes from the problem start, usually just in time for a quick fix.
  3. They’re doing an root cause analysis for you! As you can see in the mail below, the proactive alert correlates exceptions, failed dependencies, traces and every other piece of data in App Insights to try and get you the root cause right in your face.


In the below example, App Insights finds and alerts on a critical problem in my service – and immediately finds the culprit in a failing Http Dependency:

NRT


Cool AppInsights Analytics: Counting sampled data

If you’re doing stuff you’re supposed to be doing in Analytics – like slicing and dicing request, counting page views, etc. – then you should probably make sure you’re counting correctly.

2 big pitfalls here are:

  1. If you’re sampling your data with App Insights 2.0 sdk, then you should obviously reflect that when counting.
  2. If you’ve got a bunch of tests set up, then you probably don’t want to count those as page views.

For #1, you need to make sure you are always summing items – do sum(itemCount) instead of a simple count().

For #2, remember to add a where clause on the synthetic source field.

Here’s an example:

requests
| where timestamp > ago(1d)
| where operation_SyntheticSource == ""
| summarize sum(itemCount) by performanceBucket

Cool AppInsights Analytics: Charting request failure rate

Here is a really cool App Analytics query over App Insights that shows the request failure ratio of your app over the last week.

I use “extend” with the “iff” features to create a a successes field I can count, and then use “extend” again to create a failure ratio.

requests
| where timestamp > ago(7d)
| extend isSuccesss=iff(success=="True" ,1, 0)
| summarize failures=sum(1-isSuccesss) , successes=sum(isSuccesss)
by timestamp bin=20m
| extend ratio=todouble(failures) / todouble(failures+successes)
| project timestamp, failure_Percent=ratio*100
| render timechart

FailPercent


Cool AppInsights Analytics: Charting common exceptions causing failed requests

Here’s a really simple but powerful query charting the most common exceptions causing requests to fail.

We do this by first getting all the failed requests, and joining them to exceptions according to operation_id.

Then we just chart it using a timechart.

requests
| where timestamp > ago(3d)
| where success == "False"
| project timestamp, duration, id, operation_Id
| join (exceptions
   | where timestamp > ago(3d)
   | project type, method, operation_Id) on operation_Id
| summarize count() by type, timestamp bin = time(1h)
| render timechart

request_join_exceptions

Cool AppInsights Analytics: Percentiles

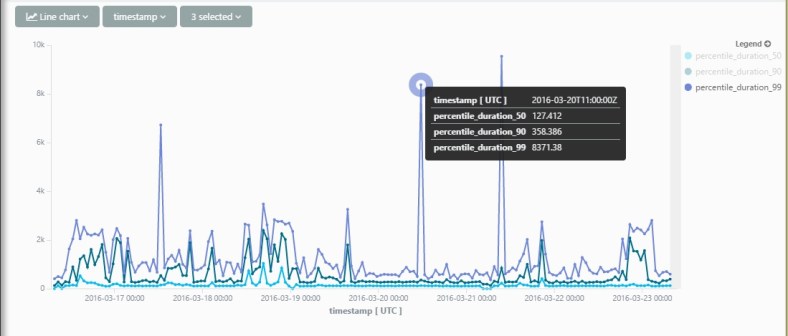
Another awesome feature in App Analytics is the ability to calculate statistics on the fly on your data. One example of that is percentile stats.

Here is an easy and extremely useful example – analyzing the duration of server requests in your service.

requests 
| where timestamp > ago(7d)
| summarize percentiles(duration, 50, 90, 99) by bin(timestamp, 1h)
| render timechart

percentile

Cool AppInsights Analytics: Custom dimensions and measurements

In App Analytics you can slice and dice on your App Insights custom dimensions and measurements just as easily as any of the so-called “standard” properties.

The only thing that’s a little bit tricky is extracting them first.

It’s tricky because of 2 things:

  1. You have to explicitly set the type of the measurement/dimension after you extract it.
  2. Extracting properties that contain spaces and special characters is a little bit of a hassle.

Here is an example of me doing both:

customEvents 
| where timestamp > ago(3h)
| where name == "Query"
| extend query_time = todouble(customMeasurements.['Query Time'])
| extend query_name = tostring(customDimensions.['Query Name'])
| project query_time, query_name
| summarize avg(query_time) by query_name 
| render barchart

CustomDimensions

If you liked this, check out some other cool analytics queries:

App Insights: Correlating your telemetry

So you’re on-boarded to App Insights.

But to really get the most of it, you really need to make sure that all the telemetry you’re sending – requests, views, events, exceptions are correlated – meaning you can easily see what happened on single operation in your service.

For web applications, events in App Insights are correlated out-of-the-box using operation id. Meaning that everything in your app does on single operation can be viewed easily in one view. This is why on a lot of blades in app insights you’ll see this button:

operation

Operation correlates all telemetry on a server request.

If you’d like to correlate everything that happens from a user session, you can also correlate using session id.

Unfortunately, this does not come ready to use for worker roles.

If you want all of your telemetry correlated on a worker role, you should implement a telemetry initializer.

An initializer will ANY TIME any piece of telemtery is ent to app insight. You can update the context of that telemetry – including the operation id.