Engagement/Usage metrics are some of the most commonly used, yet tricky to calculate metrics out there. I myself have seen just about 17 different ways to calculate stickiness, churn, etc. in analytics – each with its own drawbacks, all of them complex and hard to understand.
I’ve touched on this subject before when I offered a query for stickiness, but
- It was complex and convoluted (yes, I’ll admit it!)
- Hyper-log-log (hll) has known limitations in precision, especially when dealing with small numbers.
I’m really glad to showcase some new capabilities in Azure Log Analytics that super-simplify everything about these metrics. These are the new operators:
evaluate activity_engagement(...)evaluate activity_metrics(...)I really won’t babble too much here, there’s official documentation for that. But the basic concept is so easy you should really just try it out for yourself.
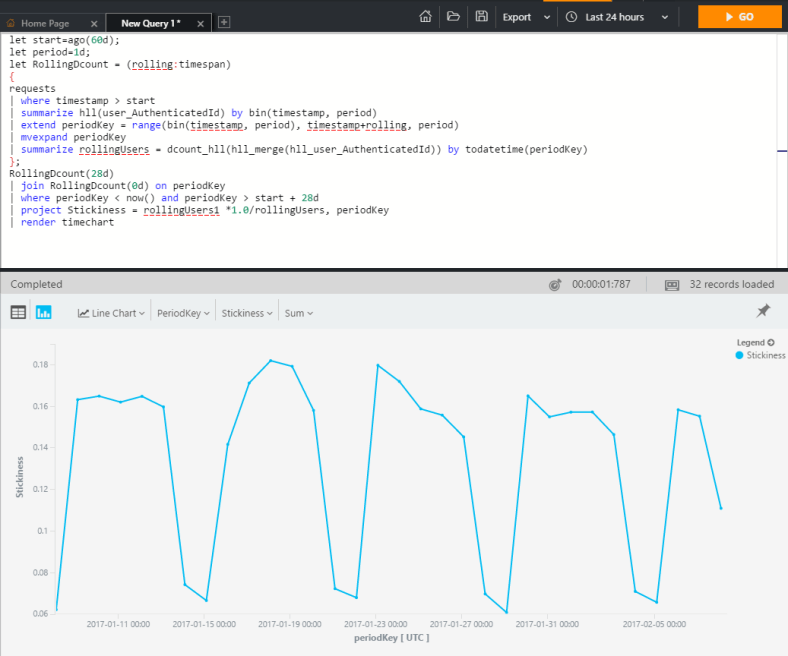
First, stickiness (rolling dau/mau). So, so simple:
union *
| where timestamp > ago(90d)
| evaluate activity_engagement(user_Id, timestamp, 1d, 28d)
| project timestamp, Dau_Mau=activity_ratio*100
| where timestamp > ago(62d) // remove tail with partial data
| render timechart
Churn + Retention rate (week over week):
union *
| where timestamp > ago(90d)
| evaluate activity_metrics(user_Id , timestamp, 7d)
| project timestamp , retention_rate, churn_rate
| where retention_rate > 0 and
timestamp < ago(7d) and timestamp > ago(83d) // remove partial data in tail and head
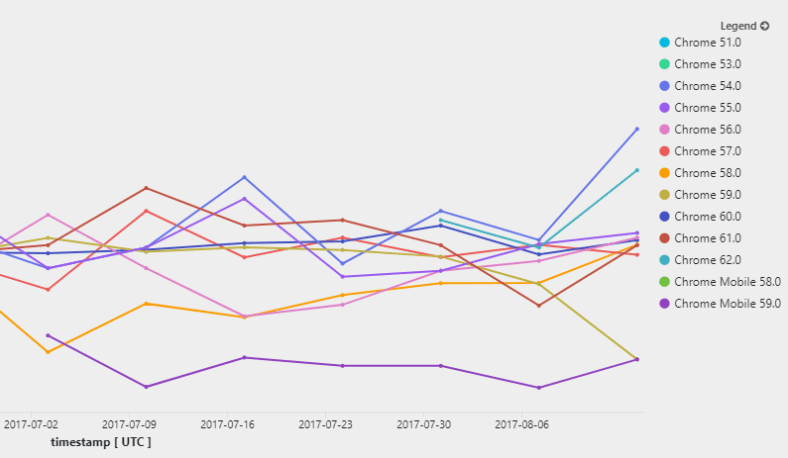
| render timechartEven cooler – you can add dimensions to slice your usage data accordingly. Here is a chart of my apps’ retention rates for different versions of the chrome browser:
union *
| where timestamp > ago(90d)
| where client_Browser startswith "chrome"
| evaluate activity_metrics(user_Id , timestamp, 7d, client_Browser   )
| where dcount_values > 3
| project timestamp , retention_rate, client_Browser
| where retention_rate > 0 and
  timestamp < ago(7d) and timestamp > ago(83d) // remove partial data in tail and head
| render timechart