Back-fill Missing Dates With Zeros in a Time Chart

A common ask I’ve heard from several users, is the ability to fill gaps in your data in Kusto/App Analytics/DataExplorer (lots of names these days!):

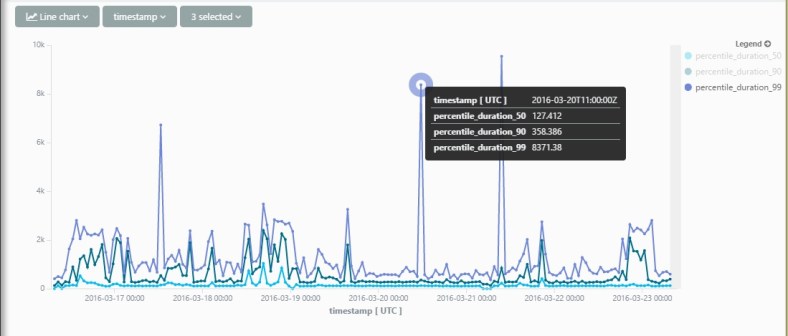
If your data has gaps in time in it, the default behavior for App Analytics is to “connect the dots”, and not really reflect that there was no data in these times. In lots of cases we’d like to fill these missing dates with zeros.

The way to go to handle this, is to use the “make-series” operator. This operator exists to enable advanced time-series analysis on your data, but we’ll just use it for the simple use-case of adding missing dates with a “0” value.

Some added sophistication is converting the series back to a *regular* summarize using “mvexpand”, so we can continue to transform the data as usual.

Here’s the query (Thanks Tom for helping refine this query!) :

let start=floor(ago(3d), 1d);
let end=floor(now(), 1d);
let interval=5m;
requests
| where timestamp > start
| make-series counter=count() default=0 
              on timestamp in range(start, end, interval)
| mvexpand timestamp, counter
| project todatetime(timestamp), toint(counter)
| render timechart


Cool AppInsights Analytics: Charting request failure rate

Here is a really cool App Analytics query over App Insights that shows the request failure ratio of your app over the last week.

I use “extend” with the “iff” features to create a a successes field I can count, and then use “extend” again to create a failure ratio.

requests
| where timestamp > ago(7d)
| extend isSuccesss=iff(success=="True" ,1, 0)
| summarize failures=sum(1-isSuccesss) , successes=sum(isSuccesss)
by timestamp bin=20m
| extend ratio=todouble(failures) / todouble(failures+successes)
| project timestamp, failure_Percent=ratio*100
| render timechart

FailPercent


Cool AppInsights Analytics: Charting common exceptions causing failed requests

Here’s a really simple but powerful query charting the most common exceptions causing requests to fail.

We do this by first getting all the failed requests, and joining them to exceptions according to operation_id.

Then we just chart it using a timechart.

requests
| where timestamp > ago(3d)
| where success == "False"
| project timestamp, duration, id, operation_Id
| join (exceptions
   | where timestamp > ago(3d)
   | project type, method, operation_Id) on operation_Id
| summarize count() by type, timestamp bin = time(1h)
| render timechart

request_join_exceptions

Cool AppInsights Analytics: Percentiles

Another awesome feature in App Analytics is the ability to calculate statistics on the fly on your data. One example of that is percentile stats.

Here is an easy and extremely useful example – analyzing the duration of server requests in your service.

requests 
| where timestamp > ago(7d)
| summarize percentiles(duration, 50, 90, 99) by bin(timestamp, 1h)
| render timechart

percentile