Update:
There is a new, simpler, better way to calculate usage metrics such as stickiness, churn and return rate.
In previous posts I demonstrated some simple yet nifty tricks to get stuff done in app insights analytics – like extracting data from traces, or joining tables.
Those were mostly pretty simple queries, showing some basic Kusto techniques.
In this post I’m going to show something much more complex, with some advanced concepts.
We’re gonna take it slow, but be warned!
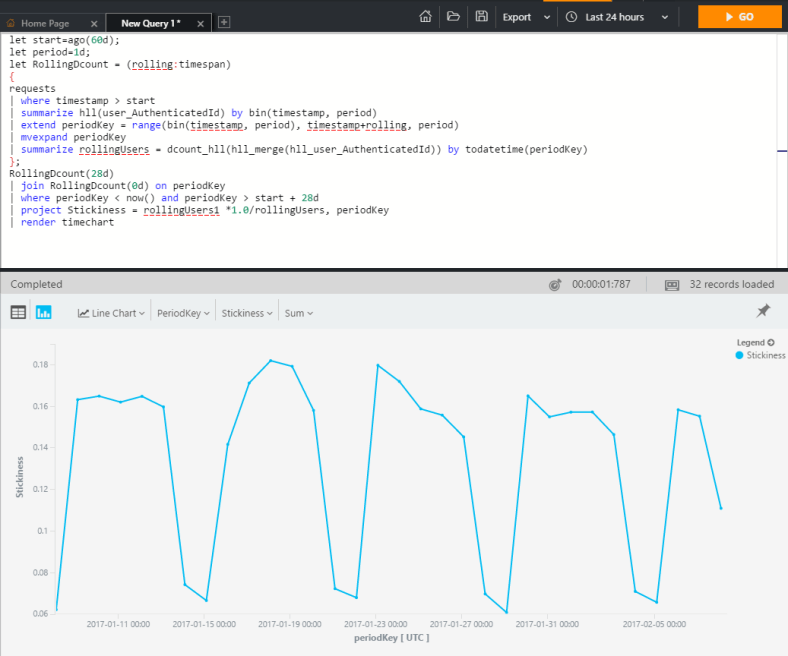
What I wanna do is calculate “Stickiness“. This is a measure of user engagement, or addiction to your app. It’s computed by dividing DAU (daily active users) by MAU (monthly active users) in a rolling 28 day window. It basically shows what percentage of your total user base is using your app daily.
Computing your DAU is pretty simple in analytics, and can be done using a simple dcount aggregation:
requests
| where timestamp > ago(60d)
| summarize dcount(user_Id) by bin(timestamp, 1d)
But how do you compute a rolling 28-day window unique count of users? For this we’re gonna need to get familiar with some new Kusto operators:
hll() – hyperloglog – calculates the intermediate results of a dcount.
hll_merge() – used to merge together several hll intermediate results.
dcount_hll() – used to calculate the final dcount from an hll intermediate result.
range() – generates a dynamic array with equal spacing
mvexpand() – expands a list into rows
let – binds names to expressions. I’ve already shown a use for let in a past post.
It’s kind of a lot, but let’s get going and see how we’re gonna use each of these along the way.
Let’s do this in steps. Our goal is to calculate a moving 28 day window MAU. First thing, instead of dcount we’ll use hll, to get the intermediate results:
requests
| where timestamp > ago(60d)
| summarize hll(user_Id) by bin(timestamp, 1d)
With the intermediate results in place, the next phase is to think about which dates will use each intermediate result. If we take 20/1/2017 as an example, well, we know that each subsequent day, 28 days forward, will want to use this hll for it’s moving window result. So we build a list of [21/1/2017, 22/1/2017 … 18/2/2017].
So what we do here, and this is a little dirty, is create a list of all the future dates that will need this result. We do this using the range operator:
requests
| where timestamp > ago(60d)
| summarize hll(user_Id) by bin(timestamp, 1d)
| extend periodKey = range(bin(timestamp, 1d), timestamp+28d, 1d)
Now let’s turn every item in the periodKey column list, into a row in the table. We’ll do this with mvexpand:
requests
| where timestamp > ago(60d)
| summarize hll(user_Id) by bin(timestamp, 1d)
| extend periodKey = range(bin(timestamp, 1d), timestamp+28d, 1d)
| mvexpand periodKey
So now, when sorting by periodKey, each date in that column has exactly 28 rows, each with an hll from a different date it needs to calculate the total dcount. We’re almost done! Let’s calculate the dcount:
requests
| where timestamp > ago(60d)
| summarize hll(user_Id) by bin(timestamp, 1d)
| extend periodKey = range(bin(timestamp, 1d), timestamp+28d, 1d)
| mvexpand periodKey
| summarize rollingUsers = dcount_hll(hll_merge(hll_user_Id)) by todatetime(periodKey)
That’s the 28 day rolling MAU right there!
Now let’s make this entire query modular, so we can calculate any length rolling dcount we’d like – including a zero day rolling (DAU actually) – and calculate our metric:
let start=ago(60d);
let period=1d;
let RollingDcount = (rolling:timespan)
{
requests
| where timestamp > start
| summarize hll(user_Id) by bin(timestamp, period)
| extend periodKey = range(bin(timestamp, period), timestamp+rolling, period)
| mvexpand periodKey
| summarize rollingUsers = dcount_hll(hll_merge(hll_user_Id)) by todatetime(periodKey)
};
RollingDcount(28d)
| join RollingDcount(0d) on periodKey
| where periodKey < now() and periodKey > start + 28d
| project Stickiness = rollingUsers1 *1.0/rollingUsers, periodKey
| render timechart
STICKINESS ON THE FLY!


