Cool uses for the top-nested operator

There’s a pretty nice operator in Kusto (or App Insights Analytics) called top-nested.

It basically allows you to do a hierarchical drill-down by dimensions. Sounds a bit much, but it’s much clearer when looking at an example!

So a simple use for it could be something like getting the top 5 result-codes, and then a drill down for each result code of top 3 request names for each RC.

requests
| where timestamp > ago(1h)
| top-nested 5 of resultCode by count(),
  top-nested 3 of name by count()

So I can easily see which operation names are generating the most 404’s for instance.

This is pretty cute, and can be handy for faceting.

But I actually find it more helpful in a couple of other scenarios.

First one is getting a chart of only the top N values. For instance, if I chart my app usage by country, I get a gazillion series of all different countries. How can I easily filter the chart to show just my top 10 countries? Well one way is to do the queries separately, and add a bunch of where filters to the chart…

But top nested can save me all that work:

let top_countries = view()
{
  customEvents
  | where timestamp > ago(3d)
  | top-nested 5 of client_CountryOrRegion by count()
};
top_countries
| join kind= inner
  (customEvents
    | where timestamp >= ago(3d)
   ) on client_CountryOrRegion
| summarize count() by bin(timestamp, 1h), client_CountryOrRegion
| render timechart

top5countries

A beautiful view of just my top 5 countries…

I’ve actually used the same technique for a host of different dimensions (top countries, top pages, top errors etc.), and it can also be useful to filter OUT top values (such as top users skewing the numbers), by changing the join to anti-join.

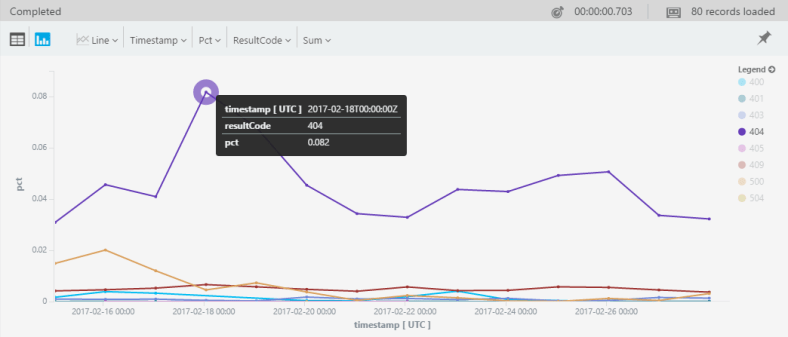
The second neat scenario is calculating percentages of a whole. For instance – how do you calculate the percentage of traffic per RC daily?

Yeah, you can do this using a summarize and the (newly-added) areachart stacked100 chart kind:

requests
| where timestamp >= ago(3d)
| where isnotempty(resultCode)
| summarize count() by bin(timestamp, 1h), resultCode
| render areachart kind=stacked100

stacked100

But this only partially solves my problem.

Because ideally, I don’t want to look at all these 200’s crowding my chart. I would like to look at only the 40X’s and 500’s, but still as a percentage of ALL my traffic.

I could do this by adding a bunch of countif(rc=403)/count(), countif(rc=404)/count()… ad nauseum, but this is tiresome + you don’t always know all possible values when creating a query.

Here’s where top-nested comes in. Because it shows the aggregated value for each level, creating the percentages becomes super-easy. The trick is simply doing the first top-nested by timestamp:

requests
| where timestamp > ago(14d)
| top-nested 14 of bin(timestamp, 1d) by count() ,
  top-nested 20 of resultCode by count()
| where resultCode !startswith("20")
| where resultCode !startswith("30")
| project pct=aggregated_resultCode * 1.0 / aggregated_timestamp, 
          timestamp, resultCode 
| render timechart
top-nested-oct

Pretty nice, no?

App Analytics: Using “Let”, and a really useful investigation query

So here’s just a small tidbit that can be useful.

First the “let” keyword – it basically allows you to bind a name to an expression or to a scalar. This of course is really useful if you plan to re-use the expression.

I’ll give an example that I use in real-life – a basic investigative query into failed requests. I’m joining exceptions and failed dependencies (similar to NRT proactive detection). I’m using the let keyword to easily modify the time range of my query.

Here it is, enjoy!


let investigationStartTime = datetime("2016-09-07");
let investigationEndTime = investigationStartTime + 1d;
requests
| where timestamp > investigationStartTime
| where timestamp < investigationEndTime
| where success == "False"
| join kind=leftouter(exceptions
   | where timestamp > investigationStartTime
   | where timestamp < investigationEndTime
   | project exception=type , operation_Id ) on operation_Id
| join kind=leftouter (dependencies
   | where timestamp > investigationStartTime
   | where timestamp < investigationEndTime
   | where success == "False"
   | project failed_dependency=name, operation_Id ) on operation_Id
| project timestamp, operation_Id , resultCode, exception, failed_dependency

App Insights Analytics: Extracting data from traces

I wanna show two real-world examples (it really happened to me!) of extracting data from traces, and then using that data to get really great insights.

So a little context here – I have a service that reads and processes messages from an Azure Queue. This message processing can fail, causing the same message to be retried many times.

I We recently introduced a bug into the service (as usual.. ) which caused requests to fail on a null reference exception. I wanted to know exactly how many messages were affected by this bug, but it was kind of hard to tell because the retries cause a lot of my service metrics to be off.

Luckily I have a trace just as I am beginning to process a message that shows the message id :

Start handling message id: 0828ae20-ba09-4f83-bb46-69f4fe25b510, dequeue count: 1, message: …

So what I did is extract the message id from the trace using a simple regex, and was then able to count messages using dcount:

traces
 | where timestamp > ago(1d)
 | where message startswith "Start handling"
 | extend messageid = tostring(extract("Start handling message id: ([^:\\/\\s]+), ", 1, message))
 | summarize dcount(messageid)

And in order to count how many messages were affected by the exception, I did a double join – to the failed requests and to exceptions tables:

requests 
| where timestamp > ago(1d)
| where success == "False"
| join (exceptions
   | where timestamp > ago(1d)
   | where type contains "NullRef"
   ) on operation_Id
| join (traces
   | where timestamp > ago(1d)
   | where message startswith "Start handling"
   | extend messageid = tostring(extract("Start handling message id: ([^:\\/\\s]+), ", 1, message))
   ) on operation_Id
| summarize dcount(messageid)

Voila!

The second example is similar, but this time I extracted a measurement.

Again I started from a trace – I have a trace detailing exactly how late a message that came in the queue is. It looks like this:

Latency: 21 minutes.

I wanted to turn these traces into measurable data that I can slice and dice on. So I used the same extend+extract method as before + a todouble:

traces
| where timestamp > ago(1d)
| where message contains "Latency: "
| extend latency = todouble(extract("Latency: ([^:\\/\\s]+) minutes.", 1, message))
| summarize percentile(latency, 90)

AWESOME!

Cool Azure Log Analytics: Joining requests and dependencies

Another cool thing you can do with App Insights Analytics is join different data types to get a good understanding of what’s happening in your app.

A great example are remote dependencies – this is an out-of-the-box feature in App Insights that logs all remote dependency calls such as SQL, Azure, http etc. If you’ve got that data flowing, you can get amazing insights with just a few small queries.

Here’s a small example – Lets’ try and find out which resources are real time-hogs in my service. The query I spun out is – per http request, get the average duration spent calling each dependency type.

requests
| where timestamp > ago(1d)
| project timestamp, operation_Id
| join (dependencies
        | where timestamp > ago(1d)
        | summarize sum(duration) by operation_Id, type 
        ) on operation_Id
| summarize avg_duration_by_type=avg(sum_duration) by type, bin(timestamp, 20m)
| render barchart

request_join_dependencies

Cool AppInsights Analytics: Charting common exceptions causing failed requests

Here’s a really simple but powerful query charting the most common exceptions causing requests to fail.

We do this by first getting all the failed requests, and joining them to exceptions according to operation_id.

Then we just chart it using a timechart.

requests
| where timestamp > ago(3d)
| where success == "False"
| project timestamp, duration, id, operation_Id
| join (exceptions
   | where timestamp > ago(3d)
   | project type, method, operation_Id) on operation_Id
| summarize count() by type, timestamp bin = time(1h)
| render timechart

request_join_exceptions